
-
Soal
Which of the following sentences is the best example of a warning?
Lihat pembahasan
Answer: B. "You must be careful when crossing the street at night." Explanation: A warning is a statement that advises someone to be cautious or avoid danger. The phrase "You must be careful when crossing the street at night." fits this definition because it alerts someone to a possible risk.
-
Soal
Which of the following expressions is NOT used to give a warning?
Lihat pembahasan
Answer: D. "Have fun!" Explanation: A warning is meant to alert someone to danger or risk, while "Have fun!" is an encouraging expression, not a warning. The other options all serve as cautionary statements.
-
Soal
Which of the following expressions is NOT a warning?
Lihat pembahasan
Answer: C. "You should take a break." Explanation: A warning is meant to alert someone to potential danger. The phrase "You should take a break." is a suggestion rather than a warning. The other options all caution someone about possible harm.
-
Soal
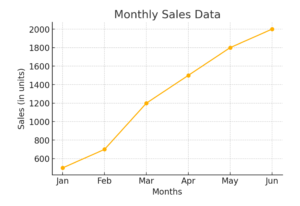
Look at the line graph below. What is the best way to describe the trend?
Lihat pembahasan
Answer: C. Sales increased steadily from January to June. Explanation: The graph shows a consistent upward trend in sales over time, indicating steady growth. There are no sharp drops or fluctuations.
-
Soal
Look at the bar chart below. What conclusion
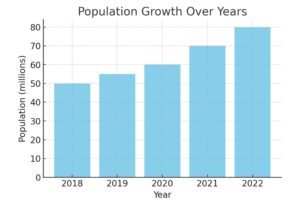
can be drawn from the data?
Lihat pembahasan
Answer: A. The bar chart illustrates the population growth over five years from 2018 to 2022. The data shows a steady and continuous increase in population, with no years showing a decline. The trend suggests that the population is consistently growing without any interruptions. Explanation: This is the correct answer because the bar chart shows a continuous increase in population every year without any decrease. Unlike other choices that mention fluctuations or declines, the data clearly follows an upward trend. Each year’s population is higher than the previous one, meaning the growth is steady and consistent. There are no signs of irregularities or unpredictable changes, which rules out other options that describe fluctuating patterns. Therefore, the best conclusion is that the population is steadily increasing without interruption.
-
Soal
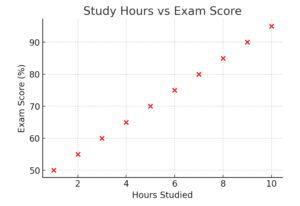
Look at the scatter plot below. What does the data suggest?
Lihat pembahasan
Answer: D. The scatter plot compares study hours with students' exam scores. The data points indicate a positive correlation, meaning that as the number of hours studied increases, the exam scores also tend to improve. This suggests that putting in more study hours can lead to better academic performance. Explanation: The correct answer is A because the data points in the scatter plot follow an upward trend, showing a clear positive correlation between study hours and exam scores. This means that students who spend more time studying tend to score higher, which directly supports the claim that increased study time leads to better performance. The other answer choices suggest a negative or no correlation, but the plotted points do not show a downward trend or randomness. Instead, they consistently indicate that higher study hours are associated with higher exam scores, making option A the most accurate description of the graph.
-
Soal
Look at the scatter plot below. What does the data suggest?
Lihat pembahasan
Answer: D. The scatter plot compares study hours with students' exam scores. The data points indicate a positive correlation, meaning that as the number of hours studied increases, the exam scores also tend to improve. This suggests that putting in more study hours can lead to better academic performance. Explanation: The correct answer is D because the data points in the scatter plot follow an upward trend, showing a clear positive correlation between study hours and exam scores. This means that students who spend more time studying tend to score higher, which directly supports the claim that increased study time leads to better performance. The other answer choices suggest a negative or no correlation, but the plotted points do not show a downward trend or randomness. Instead, they consistently indicate that higher study hours are associated with higher exam scores, making option D the most accurate description of the graph.
-
Soal
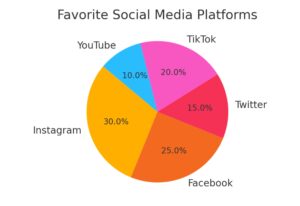
In a recent survey conducted among high school students, researchers wanted to find out which social media platform is the most popular among teenagers. The results were compiled into a pie chart, which shows the percentage of students who prefer different social media platforms, including Instagram, Facebook, Twitter, TikTok, and YouTube. As a data analyst, you are asked to interpret the pie chart and determine which social media platform is the most preferred based on the proportions shown in the graph. After carefully analyzing the pie chart, what can you conclude about the students’ social media preferences?
Lihat pembahasan
Answer: C. The pie chart represents the popularity of different social media platforms among users. Instagram holds the largest percentage, making it the most preferred platform among the options. This suggests that more people favor Instagram over Facebook, Twitter, TikTok, and YouTube. Explanation: The correct answer is A because the pie chart clearly shows that Instagram has the largest portion, meaning it has the highest percentage of users compared to the other platforms. While other platforms like Facebook, Twitter, and TikTok are represented, none of them take up a larger share than Instagram. This directly contradicts choices that claim another platform is dominant. Since the pie chart is designed to represent the distribution of user preference, and Instagram occupies the biggest section, it logically follows that Instagram is the most preferred social media platform.
-
Soal
In a recent survey conducted among high school students, researchers wanted to find out which social media platform is the most popular among teenagers. The results were compiled into a pie chart, which shows the percentage of students who prefer different social media platforms, including Instagram, Facebook, Twitter, TikTok, and YouTube. As a data analyst, you are asked to interpret the pie chart and determine which social media platform is the most preferred based on the proportions shown in the graph. After carefully analyzing the pie chart, what can you conclude about the students’ social media preferences?
Lihat pembahasan
Answer: C. The pie chart represents the popularity of different social media platforms among users. Instagram holds the largest percentage, making it the most preferred platform among the options. This suggests that more people favor Instagram over Facebook, Twitter, TikTok, and YouTube. Explanation: The correct answer is C because the pie chart clearly shows that Instagram has the largest portion, meaning it has the highest percentage of users compared to the other platforms. While other platforms like Facebook, Twitter, and TikTok are represented, none of them take up a larger share than Instagram. This directly contradicts choices that claim another platform is dominant. Since the pie chart is designed to represent the distribution of user preference, and Instagram occupies the biggest section, it logically follows that Instagram is the most preferred social media platform.
-
Soal
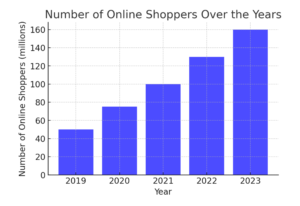
Look at the bar chart below. What is the best way to describe the trend?
Lihat pembahasan
Answer: A. The number of online shoppers has increased steadily over the years, showing a consistent upward trend. Each year, more people have turned to online shopping, and the data suggests continued growth in the future. Explanation: The correct answer is A because the bar chart clearly shows a continuous increase in the number of online shoppers from 2019 to 2023. Unlike the other answer choices, which mention fluctuations, declines, or stability, the data consistently rises each year without any drops. The steady growth pattern suggests that online shopping is becoming more popular over time. Since there is no decline or inconsistency, we can conclude that the number of online shoppers continues to grow and is expected to increase further in the future.
-
Soal
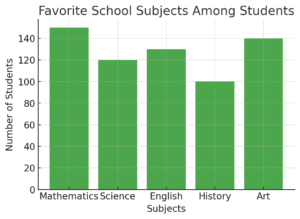
Look at the bar chart below. What can you conclude about students’ favorite school subjects?
Lihat pembahasan
Answer: A. The bar chart shows that Mathematics is the most popular school subject among students, as it has the highest number of votes. Other subjects like Science and English are also popular, but no subject surpasses Mathematics in preference. Explanation: The correct answer is A because the bar chart clearly indicates that Mathematics has the highest number of votes (150 students), making it the most preferred subject. While other subjects like Science (120 students), English (130 students), and Art (140 students) are also favored, none surpass Mathematics in total votes. The other answer choices misinterpret the data—for example, History (100 students) is not the most popular, and the subjects are not equally distributed. Therefore, the most accurate interpretation is that Mathematics is the students’ most preferred subject, followed by Art, English, and Science.
Gratis — tolong sebarkan
Materi dan latihan di sini bisa dipakai siapa saja tanpa membayar dan tanpa mendaftar. Aplikasi Fitri Learning membawa semuanya ke HP, lengkap dengan nilai dan pembahasan, dan jalan tanpa internet setelah diunduh sekali.
Gratis, tanpa akunUnduh aplikasinya → Ilmu yang bermanfaatBagikan ke WhatsApp